

Renewable Energy Portfolio Management: When Late Tasks Reveal an Operational Pattern
A well-run portfolio runs on work that is mostly invisible — and too often thankless. The signs of it show up in patterns: which obligations get fulfilled on time, which ones drift, which behaviors are quietly normalizing. Most asset management platforms don’t keep the kind of record that lets you see them.
A spreadsheet may give you a list, and many software applications can tell you what was resolved, by whom, and when. But neither tells you what has been happening over six months— which patterns are building, which behaviors are drifting, or which obligations are quietly normalizing.
Late tasks, looked at one-by-one, are items to clear. Looked at together over months, they are a dataset.
Four Obligation Signals Your Late Task List Has Been Carrying All Along
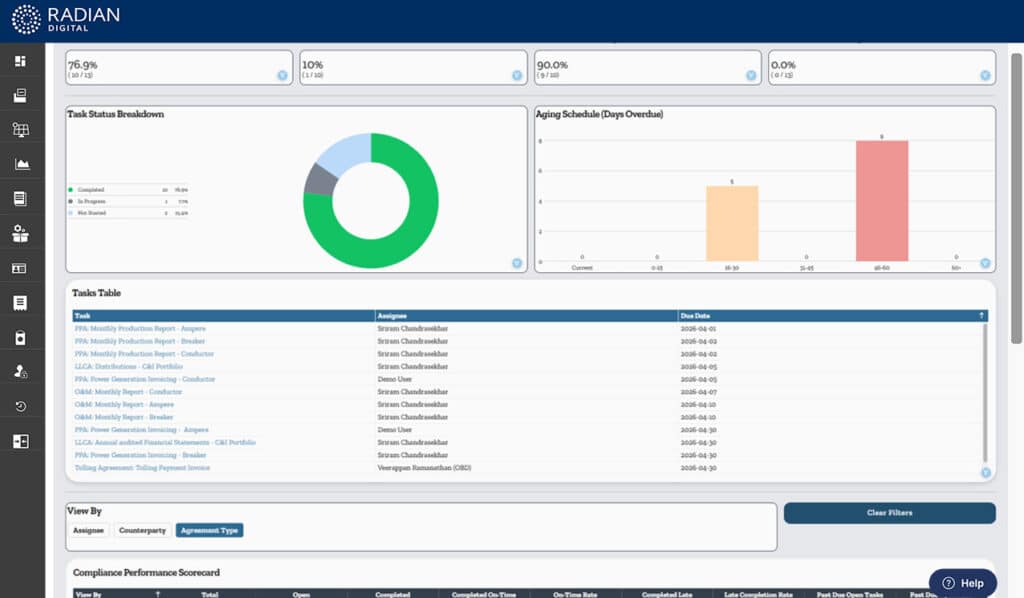
Let’s say a portfolio manager opens their task view on a Tuesday morning. The portfolio shows fifteen late tasks across thirty-two assets. That’s a familiar number; the kind of metric a manager checks reflexively and moves past.
But what happens if you don’t move past it? Looking at the big picture presents the opportunity to catch the patterns that are derailing progress, and address the underlying cause, rather than applying one-by-one solutions.
Across the portfolios we manage, four kinds of patterns emerge:
Dependencies: A monthly or quarterly compliance task that is completed late, every time. At first it looks like sloppy execution, but the frequency of the task being “blocked” shows it’s beyond the assignee. It’s often a calendar problem: the cadence the team is running against doesn’t match the cadence the obligation actually requires. Correction isn’t escalating individual instances. Instead it’s resequencing where in the month the task gets created.
Workflow under-resourcing: A category of obligation that consistently runs three to five days late, across many instances and many assets. Each instance looks routine. The aggregate says that category was never resourced for the volume coming through it. The fix is in the process, automation, or budgeting the hours it actually takes.
Counterparty drift: A counterparty whose obligations arrive late 60–70% of the time, with no contractual consequence attached. No single late delivery is worth escalating. As a pattern, though, it says the counterparty’s interpretation of response windows has been quietly normalizing. The action is rarely a stronger email on the next overdue item. It’s pulling the original agreement, checking whether the language permits the loose interpretation, and putting a clarification on record before the next compliance cycle.
Quiet decline on the team: A team member’s late-resolution rate creeping up over four months against a portfolio of work that hasn’t gotten harder. Any individual miss looks like a one-off, and trends are something that coaching conversations and quarterly reviews often miss. The action is the conversation, not the task.
None of these patterns show up in a real-time dashboard, and none of them are in last week’s exception report. They show up when months of resolution timestamps are grouped by the right dimension, against a taxonomy that is consistent.
Why Your Compliance Data Is Fractured Before It Can Become a Pattern
Three things have to be true for any of those patterns to surface at all.
First, tasks have to be the unit of record. The obligation, the party responsible for it, and the audit trail of how it got fulfilled have to sit on the same record. It’s fairly common for these to exist in separate systems, where task assignment lives in one and resolution lives in another. Even worse, it’s often in spreadsheets— many of them owned by different people, with different conventions, and no single one the team fully trusts. The pattern data is fractured before it can accumulate.
Second, the taxonomy has to be structural, not editorial. In Radian Digital, every task ties to a specific agreement, and every agreement carries a type. Patterns aggregate by agreement type, not by whatever a user typed in a description field in February versus May. That difference is what separates a taxonomy that still means something six months later from one that quietly degrades into freehand notes.
And third, there has to be enough time. A month isn’t enough to distinguish a habit from a coincidence. Three months starts to mean something, and six months means a lot. There is value on day one, but the patterns aren’t readily visible just yet. Fortunately, for new clients at Radian, the structure is built-in from the start. The Software Services team, which sees these patterns across every implementation, knows what to look for. While the data may take months to accumulate, getting the feel for what to look for doesn’t have to wait that long.
Is Your Renewable Energy Platform Managing Risk or Just Recording It?
One query is enough to know whether your current platform produces this kind of view.
Ask it to show you the counterparty or team member in your portfolio with the highest rate of late resolution over the last two quarters, and whether that rate is rising or falling.
If the platform can’t produce the answer, the task data either doesn’t exist as a coherent record, or it does but the taxonomy hasn’t been operated long enough for the answer to mean anything.
If you run that query and don’t like the answer, that is the conversation worth having.